Spectroscopy Research
There are thousands of stars visible to the unaided eye, and many more which can be seen through a small telescope or even a pair of binoculars. These distant objects can be difficult to study from Earth, but tools like spectroscopy allow scientists to learn a lot about the stars above us.
Exploring the Distant Stars
Each of the stars in the night sky emits light, but the kind of light emitted is not always the same. While all are composed of hydrogen and helium, different kinds of stars have slightly different amounts of heavier elements like carbon, nitrogen, and oxygen, and these different compositions can change the light reaching Earth.
Stars generally emit a continuous spectrum - a range of all wavelengths of visible light. However, when that light passes through the star's atmosphere, some wavelengths are absorbed, creating absorption lines, or gaps, in the light spectrum.
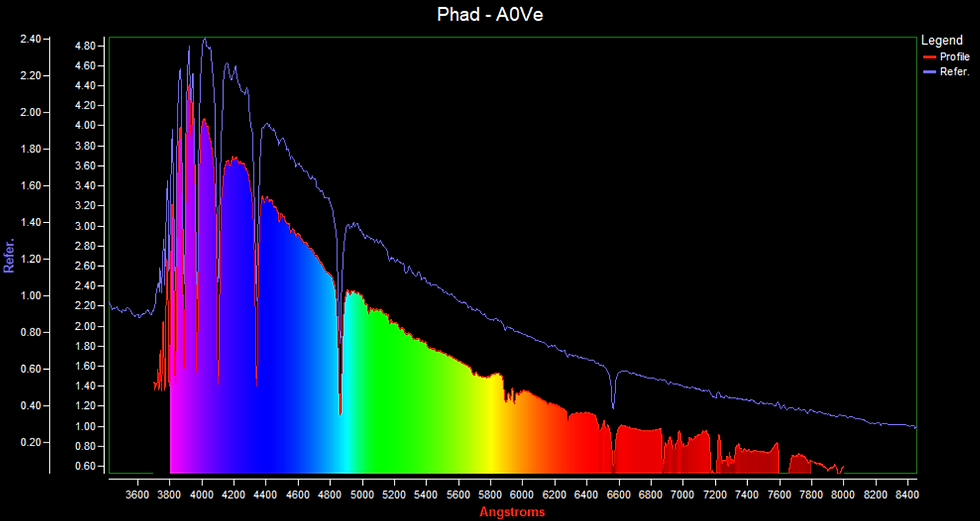
At DPAS, we use a SA100 diffraction grating to split apart the light from a star into a spectrum of different wavelengths. This spectrum can be graphed, including the "dips" in the graph where absorption lines are located. Differences in spectrums are also part of the criteria used to classify different types of stars.
All DPAS stellar spectrums are included in the American Association of Variable Star Observers (AAVSO) database.
Our captured spectrum of Capella is shown here (red line) with the reference spectrum for a type G5I star (blue).
The peak of the graphs are in the yellow visible light range, which explains the obvious yellow color of this star in the night sky. This is a characteristic of G - type stars.


There is good agreement between the captured data (red) and the reference continuum for 5000K (blue). The accepted value of the surface temperature for Capella is 4970K.

Navi is a blue B - type star. The peak emission in the violet range is responsible for its blue appearance.
Based on our data, we would probably accept the reference temperature of 25,000K for Navi as being correct.
Uranus: Observing in Our Solar System
Within our own solar system, spectroscopy can be used to look at the composition of other planets. Light traveling to the planet Uranus from the sun is reflected back with new characteristics. The absorption lines found in the light from a planet can be used to identify what that planet is made of. For Uranus, this means little absorption in the blue wavelengths, while the pattern of absorption lines in the red wavelengths indicate the presence of atmospheric methane.

Lemon Slice Nebula: Peering into Deep Space
Aside from the stars and planets, deep space is filled with other objects. A planetary nebula is formed at the end of a middle-mass star's lifespan, when it begins to eject its outer layers into the surrounding space. This forms an expanding, glowing shell of ionized gas, the composition of which can be determined by spectroscopy. In the case of IC 3568, the Lemon Slice Nebula, that composition consists largely of doubly ionized oxygen.

PG 0804: Proving Hubble Right
One of the greatest discoveries of astronomer Edwin Hubble was that the universe is expanding. Distant objects moving away from us experience redshift, meaning that the light reaching us is shifted toward the red part of the spectrum. Hubble found that all distant objects experience this, and that the universe must be expanding.
The quasar PG 0804 is located 1.3 billion light-years away, containing a supermassive black hole with a mass two billion times that of our Sun. Collecting data on this distant object, DPAS saw that the light was shifted toward the red part of the spectrum. The Ha (Hydrogen-Alpha) emission line was measured at a wavelength of 7217 angstroms, while the accepted value for this line is 6563 angstroms. This resulted in a calculated redshift (z) of 0.1, which is the recognized number for this value.

Our Spectrums


